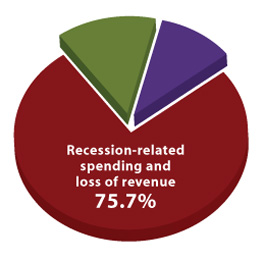
It’s said that “a picture is worth a thousand words.” We’ve been blogging a lot lately about the federal deficit, economic inequality, and supply side economics, and when we found this pie chart we thought it was worth sharing with readers. It shows that the deficit increases when people are unemployed and have their hours cut back, and that the deficits will decrease when the economy improves and puts people back to work. The economic recession is a crisis, caused by Wall Street greed and Republican de-regulation, and is mainly responsible for the current rising federal deficits.
Add a Comment
You must be logged in to post a comment